")
Elaine Rosa Salo
")
Women human rights defenders (WHRDs) worldwide defend their lands, livelihoods and communities from extractive industries and corporate power. They stand against powerful economic and political interests driving land theft, displacement of communities, loss of livelihoods, and environmental degradation.
Extractivism is an economic and political model of development that commodifies nature and prioritizes profit over human rights and the environment. Rooted in colonial history, it reinforces social and economic inequalities locally and globally. Often, Black, rural and Indigenous women are the most affected by extractivism, and are largely excluded from decision-making. Defying these patriarchal and neo-colonial forces, women rise in defense of rights, lands, people and nature.
WHRDs confronting extractive industries experience a range of risks, threats and violations, including criminalization, stigmatization, violence and intimidation. Their stories reveal a strong aspect of gendered and sexualized violence. Perpetrators include state and local authorities, corporations, police, military, paramilitary and private security forces, and at times their own communities.
AWID and the Women Human Rights Defenders International Coalition (WHRD-IC) are pleased to announce “Women Human Rights Defenders Confronting Extractivism and Corporate Power”; a cross-regional research project documenting the lived experiences of WHRDs from Asia, Africa and Latin America.
"Women Human Rights Defenders confronting extractive industries: an overview of critical risks and Human Rights obligations" is a policy report with a gender perspective. It analyses forms of violations and types of perpetrators, quotes relevant human rights obligations and includes policy recommendations to states, corporations, civil society and donors.
"Weaving resistance through action: Strategies of Women Human Rights Defenders confronting extractive industries" is a practical guide outlining creative and deliberate forms of action, successful tactics and inspiring stories of resistance.
The video “Defending people and planet: Women confronting extractive industries” puts courageous WHRDs from Africa, Asia, and Latin America in the spotlight. They share their struggles for land and life, and speak to the risks and challenges they face in their activism.
Challenging corporate power: Struggles for women’s rights, economic and gender justice is a research paper outlining the impacts of corporate power and offering insights into strategies of resistance.
AWID acknowledges with gratitude the invaluable input of every Woman Human Rights Defender who participated in this project. This project was made possible thanks to your willingness to generously and openly share your experiences and learnings. Your courage, creativity and resilience is an inspiration for us all. Thank you!
Estamos comenzando un nuevo año: 2023. El COVID-19 continúa infectando y re infectando a muchas, muchas personas en todo el mundo. Estamos siendo testigos del resurgimiento de gobiernos de derecha y fascistas, incluso en lugares que quizás no esperábamos, como Suecia. La guerra, los conflictos armados y el aumento dramático de la militarización, el militarismo y el gasto militar están permitiendo la acumulación descomedida de capital por parte de unos pocos, con la participación de alianzas aparentemente "extrañas" que se arman, tanto de manera visible como invisible, donde las élites económicas y políticas del Norte y el Sur Global se están beneficiando más allá de nuestra imaginación más desenfrenada. Mientras tanto, nuestra gente y el medio ambiente natural pagan enormes costos y sufren todas las esperadas e inesperadas consecuencias.
Como todes ustedes y todes nosotres en AWID sabemos, les feministas en múltiples movimientos alrededor del mundo están resistiendo y organizándose contra las múltiples caras de la tiranía, creando estructuras alternativas, implementando estrategias de base y construyendo alianzas transnacionales. Estamos generando alegría, inspirándonos unes a otres, cantando y bailando dentro y en contra de la cultura predominante de muerte y cinismo que parece haber envuelto a gran parte del mundo.
Nosotres, el personal y la Junta Directiva de AWID, estamos más preparades e inspirades que nunca para enfrentar los desafíos, fortaleciendo nuestras relaciones con nuestra membresía y organizaciones socias, reuniéndonos y conociendo a quienes aún tenemos que conocer y hacer lo que hacemos mejor: apoyar a los movimientos feministas globales. Aunque nos entristeció la partida de nuestras queridas ex-co-eds Cindy y Hakima, nuestras maravillosas nuevas co-eds Faye e Inna, junto con el personal comprometido y creativo, han aprovechado el momento que encapsula tanto las oportunidades como las amenazas.
Sin duda, todes nosotres en AWID y toda la gente de nuestro movimiento lo sabemos… como escribió la poeta y activista caribeña estadounidense June Jordan a las mujeres activistas sudafricanas durante el apogeo del régimen del apartheid: “¡Somos quienes hemos estado esperando!”
Nos esforzamos por ser transparentes, por utilizar nuestros recursos en forma responsable, por ser equitativxs en nuestras colaboraciones, y por ser responsables e íntegrxs con nuestrxs afiliadxs, contrapartes y donantes, y con los movimientos con los que trabajamos y en los que participamos. Estamos comprometidxs a reflejar nuestras experiencias, a compartir abiertamente nuestrxs aprendizajes, y a esforzarnos por cambiar nuestras prácticas en consecuencia.
Se rassembler à l’échelle mondiale, en tant qu’individus et mouvements, nous permet de générer une force considérable. Rejoignez-nous à Bangkok, en Thaïlande et en ligne en décembre 2024.
Alejandra is passionate about women’s rights and gender justice. She dreams of creating a world that centers care – for people and nature. As a feminist human rights expert, she’s worked at the intersections of gender, climate, social and economic justice at various international organizations. Her areas of expertise include knowledge building and co-creation, research, facilitation, and advocacy. She holds a MA in Human Rights from the University of Essex and has authored and co-developed many publications, including the article “Enraged: Women and Nature”. The campaign Feminist Activism Without Fear draws on interviews and research carried out by Alejandra. Originally from Argentina, she has lived and worked in several countries in Europe and Latin America over the past two decades. Alejandra loves photography, the sea, baking with her daughter, and enjoying food from around the world. As a mother, she aims to be a cycle breaker. Alejandra draws energy and inspiration from the amazing women in her life, who are spread in many corners of the world.
Nuestra base de datos de donantes y patrocinadores se encuentra actualmente en revisión. ¡Sabemos que los movientos feministas todavía necesitan y merecen más y mejores recursos!
Únete a nuestra lista de correo para mantenerte al tanto sobre esta actualización.
También puedes afiliarte a AWID y encontrar y crear conexiones con feministas de todo el mundo.
Étant donnée la situation mondiale, notre Conseil d’administration a pris la décision difficile d’annuler le Forum, qui devait avoir lieu en 2021 à Taipei.
")
✉️ By registration for larger groups. Drop-ins for smaller groups. Register here
📅 Tuesday, March 11, 2025
🕒 12.00-2.00pm and 4.00-6.00pm EST
🏢 Chef's Kitchen Loft with Terrace, 216 East 45th St 13th Floor New York
Organizer: AWID
Nuestrxs afiliadxs conforman una dinámica red de personas de todo el mundo, que se desempeñan como investigadorxs, académicxs, estudiantes, educadorxs, activistas, empresarixs, diseñadorxs de políticas públicas, personas que trabajan en desarrollo, donantes, y más. La membresía - de todas las edades – es lo que hace de AWID una asociación feminista mundial única.
Ofrecemos diferentes tipos de membresía según el nivel de ingresos y también según quieras afiliarte a título individual o institucional. En la actualidad contamos con más de 5000 afiliadas/os, individuales e institucionales, de 164 países.
Ofrecemos diferentes tipos de membresía según el nivel de ingresos y también según quieras afiliarte a título individual o institucional. En la actualidad contamos con más de 5000 afiliadxs, individuales e institucionales, de 164 países.
Colaboramos en acciones de incidencia sobre temas específicos; la membresía vota y elige a la Junta Directiva y también puede participar y contribuir en las Áreas Prioritarias, por ejemplo, a través de webinarios, encuestas o acciones urgentes.
La membresía institucional la constituye una amplia gama de organizaciones interesadas en el avance de la justicia de género y los derechos humanos de las mujeres, incluyendo organizaciones por los derechos de las mujeres del ámbito local al mundial, de redes de base, instituciones internacionales de gran escala, departamentos gubernamentales, programas universitarios y más. El 63% de lxs afiliadxs pertenece al sur global y el 38% es menor de 30 años de edad.
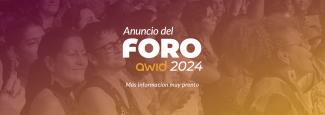
Cuando miles de feministas se unen, creamos una fuerza arrolladora de solidaridad que tiene el poder de cambiar el mundo. El Foro de AWID será un momento para que descansemos y nos recuperemos juntas, nos conectemos más allá de las fronteras y descubramos nuevas y osadas direcciones estratégicas.
La fecha y el lugar se anunciarán el próximo año, tan pronto como podamos. Estamos emocionades y sabemos que ustedes también lo están. ¡Manténganse al tanto!
¡Asegúrate de seguirnos en las redes sociales y suscríbete a nuestra lista de correo para mantenerte al día!
")
Nous ne pouvons pas examiner les propositions ou les demandes de financement.
Nous vous invitons à consulter notre liste de bailleurs fonds pouvant potentiellement financer votre organisation pour les droits des femmes
Voir notre liste de bailleurs de fonds (en anglais)
Plus de ressources sont disponible depuis la page de Domaine prioriataire Ressources des mouvements féministes
Merci de votre visite sur le site d'AWID. Pour plus d'informations sur AWID rendez-vous sur https://www.awid.org/fr
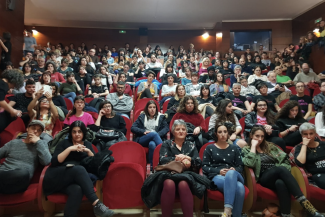
por Karina Ocampo
A un rincón escondido de Chiapas, México, llegamos mujeres y disidencias sexuales para organizar nuestras acciones. (...)
< arte: «Proyecto fotográfico: La muerte sale por el Oriente», de Sonia Madrigal