
Salwa Bugaighis

Over the past few years, a troubling new trend at the international human rights level is being observed, where discourses on ‘protecting the family’ are being employed to defend violations committed against family members, to bolster and justify impunity, and to restrict equal rights within and to family life.
The campaign to "Protect the Family" is driven by ultra-conservative efforts to impose "traditional" and patriarchal interpretations of the family, and to move rights out of the hands of family members and into the institution of ‘the family’.
Since 2014, a group of states have been operating as a bloc in human rights spaces under the name “Group of Friends of the Family”, and resolutions on “Protection of the Family” have been successfully passed every year since 2014.
This agenda has spread beyond the Human Rights Council. We have seen regressive language on “the family” being introduced at the Commission on the Status of Women, and attempts made to introduce it in negotiations on the Sustainable Development Goals.
AWID works with partners and allies to jointly resist “Protection of the Family” and other regressive agendas, and to uphold the universality of human rights.
In response to the increased influence of regressive actors in human rights spaces, AWID joined allies to form the Observatory on the Universality of Rights (OURs). OURs is a collaborative project that monitors, analyzes, and shares information on anti-rights initiatives like “Protection of the Family”.
Rights at Risk, the first OURs report, charts a map of the actors making up the global anti-rights lobby, identifies their key discourses and strategies, and the effect they are having on our human rights.
The report outlines “Protection of the Family” as an agenda that has fostered collaboration across a broad range of regressive actors at the UN. It describes it as: “a strategic framework that houses “multiple patriarchal and anti-rights positions, where the framework, in turn, aims to justify and institutionalize these positions.”
|
Co-editeurices Création graphique et illustration Stratège des communications Editrice de la langue arabe Responsable de la traduction
Relecture |
Traduction arabe
Relecture
Relecture |
ترجمة مايا زبداوي

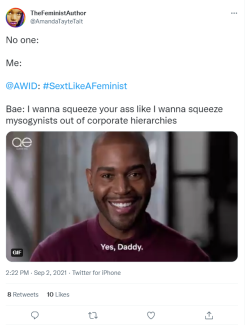
رغبتي في الانقضاض على جسدك تعادل رغبتي بالانقضاض على كراهية النساء المتجذرة في التسلسلات الهرمية للشركات

The Call for Activities lists a number of suggested formats and methodologies. Be creative and make sure to read the section “What you need to know”.
Upasana es unx ilustradorx y artista no binarie de Calcuta, India. Su obra explora narrativas identitarias y personales, que empean restos o evidencias visuales de los contextos con los que trabaja. Le atraen especialmente los diseños en patrones que, para ellx, comunican verdades complejas sobre el pasado, el presente y el futuro. Cuando Upasana no está ilustrando, organiza y dirige un centro de arte comunitario queer y trans de la ciudad.

Si tu actividad es seleccionada, el equipo de AWID te contactará para evaluar y responder a tus necesidades de interpretación y accesibilidad.
En partenariat avec de jeunes activistes féministes et des organisations dirigées par des jeunes, l'AWID co-organise Beijing sans Entraves en parallèle et indépendamment de Beijing + 25.

يعقد كل منتدى في منطقة مختلفة، وقد حان الوقت لعودة منتدى جمعية حقوق المرأة في التنمية إلى آسيا! قمنا بزيارة العديد من البلدان في المنطقة، واستشرنا الحركات النسوية، وأجرينا تقييمات مفصلة للخدمات اللوجستية، وإمكانية الوصول، والسلامة، والتأشيرات، وغيرها من التفاصيل. وفي نهاية المطاف، وافق مجلس إدارة جمعية حقوق المرأة في التنمية على إقامة المنتدى في بانكوك، تايلاند، باعتبارها الخيار الأفضل. نحن متحمسون/ات للعودة إلى بانكوك، حيث عقدنا منتدى جمعية حقوق المرأة في التنمية في عام 2005.
Hakima Abbas, AWID
"We're using the tools that we have to share our resistance, strategies and continue to build our power to take action and create new brave and just worlds."

Tonya Haynes, CAISO
Angelique V. Nixon, CAISO

ในหัวข้อ เปิดรับสมัครกิจกรรม แสดงรายการรูปแบบและวิธีการจัดกิจกรรมที่แนะนำจำนวนหนึ่ง ใช้ความคิดสร้างสรรค์และอย่าลืมอ่านหัวข้อ “สิ่งที่คุณต้องรู้”
Naike Ledan
Semi Kaefra Alisha Fermond, Trans Rights Activist ACIFVH
Natalie Desrosiers
Fédorah Pierre-Louis